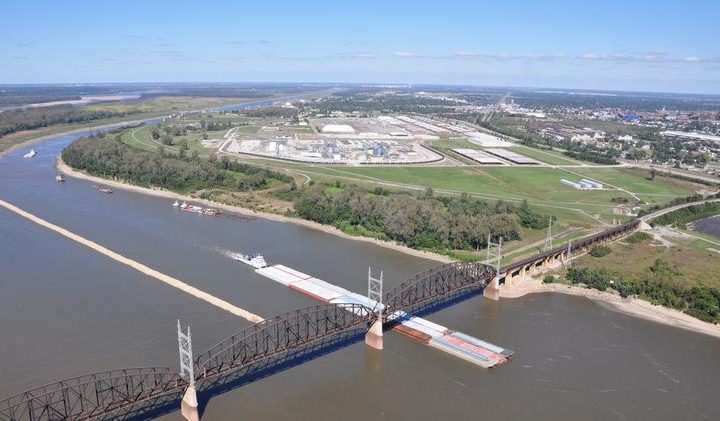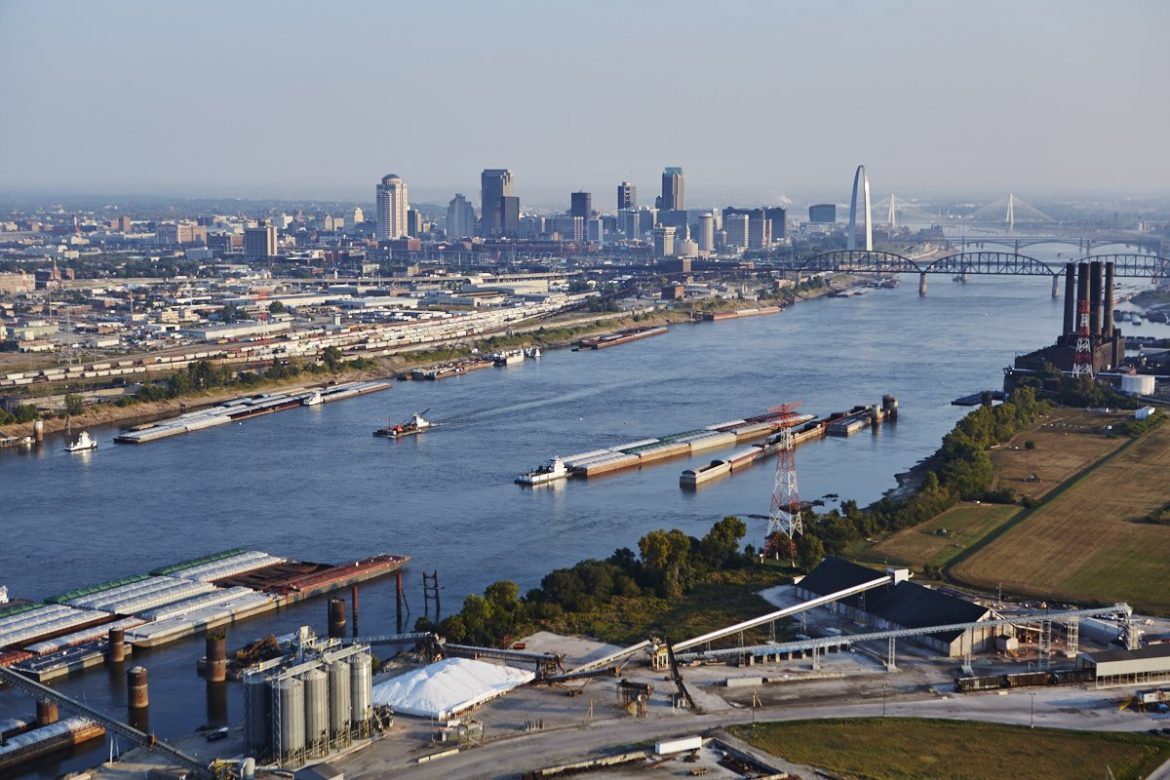
The latest data from the U.S. Army Corps of Engineers (USACE) reveals the St. Louis regional ports moved from the third position into the second position for inland port total tonnage in the 2018 rankings. The port system handled 37.4 million tons of commodities over the course of the year, a 13.2% increase over the prior the year. Just 1.1 million tons separated it from the top position, which the Port of Cincinnati/Northern Kentucky held onto, despite a drop in its total tonnage for the year. The rise in the rankings adds to the accolades for the St. Louis region, which continues to rank as the most efficient inland port district* in the nation in terms of tons moved per river mile. During 2018, the St. Louis region’s barge industry handled more than 534,000 tons per mile along the 70 miles that make up the port system. The system also has the second highest concentration of port facilities per mile of all inland ports, contributing to growing awareness of a 15-mile stretch of the Mississippi River that flows through southwestern Illinois and eastern Missouri at St. Louis known as the Ag Coast of America.
“For you as a region to come up to #2 for total tonnage is a real accomplishment, but it’s not surprising as St. Louis has been gaining for a while,” said Ken Eriksen, Senior Vice President with IHS Markit, a world leader in critical information, analytics and solutions for the major industries and markets that drive economies worldwide.
Eriksen notes there are several things contributing to the positive trends for the St. Louis region’s port system, among them the fact that there is only one set of locks between St. Louis and Asia, and that is the Panama Canal. He also highlighted the deeper draughts that allow for barges to be loaded heavy, rail access in the region from both sides of Mississippi River and the presence of six Class I railroads, the surplus supply of grain available and the available supply of corn that can come to the river all the way from Minneapolis. He adds that there is also growing demand from Indonesia, Vietnam and Thailand that want to source from the Mississippi River system, which is recognized for better soybeans with higher protein and better oil quality.
“The St. Louis region has become a vital spot on the map from the grain perspective,” Eriksen said.
Corn, soybeans and unclassified oilseeds were certainly among the commodities that contributed to the increased tonnage moving through the St. Louis area ports, but crude oil was also up significantly over 2017 as the United States became a net exporter of oil, and iron ore more than doubled, likely tied to the resumption of operations at U.S. Steel’s facility in Granite City, Illinois.
SCF Marine Inc, which provides integrated logistics and barge transportation services on the U.S. Inland Waterways as well as in South America and has operations in the St. Louis Port District, is seeing firsthand the impact of the growing volumes of commodities moving through the region.
“The increased demand for transload capacity resulted in increased operational hours, demand for barges, and labor needs,” said Tim Power, President of SCF Marine Inc. “Because St. Louis is an important intersection point for all Class I railroads, multiple interstate highways and the river transportation system, we are able to pull grain from surplus regions in the west and north, funneling grain to the river system via our ports.”
The region’s commitment to investing in its freight network is key to accommodating continued growth in tonnage.
“We know when we do not invest in infrastructure, nothing moves. When we do, it creates the opportunity for optionality,” said Eriksen. “Infrastructure is everything. It supports rolling and floating assets alike. We see more coming into the St. Louis area to take full advantage of the optionality here and get the most favorable price,” Eriksen said.
Mary Lamie, Executive Vice President of Multimodal Enterprises at Bi-State Development and head of the St. Louis Regional Freightway, notes that, based on their tracking, more than $1 billion in critical infrastructure projects are moving forward across the St. Louis region.
“Investment in infrastructure is key to supporting the barge industry and critical for maintaining global competitiveness, so it’s very encouraging to see public and private funding advancing some of the region’s highest priority projects,” said Lamie. “On top of that, continuing investments in the ports and river terminals along the Ag Coast of America have created a highly competitive shipper and carrier market featuring greater efficiencies and lower costs.”
As to whether the positive trends are likely to continue, both Eriksen and Power said they believe any improved trade relations with China would benefit the St. Louis region.
“The St. Louis to New Orleans barge route is one of the most efficient logistics export streams in the U.S., and there typically is an abundance of corn in the region,” Power said. “St. Louis is directly tied to U.S. export markets, including China, so any increase in trade volumes would improve operational conditions.”
Planned closures on the Illinois waterway system later this year will have an impact on commodity flows for 2020, but given the strength and flexibility of the St. Louis region’s port system and surrounding freight network, there is potential for that impact to be positive.
“As with any closure, flows will adjust as needed. Given the close proximity to the lower Illinois River, increased volume through the St. Louis region’s port system is likely,” said Power. “With the length of the projected closure, a large volume of products will need to be rerouted or stored until the river re-opens.”
| Port | Total Tonnage* | % Change in Tonnage | Port Length
(Per USACE) |
Tons/Mile | Efficiency Rank** |
| 2017 -2018 | |||||
| Port of Cincinnati-Northern KY | 38.5M | -9.70% | 226 miles | 170,354 | 3 |
| St. Louis, MO and IL | 37.4M | 13.20% | 70 miles | 534,285 | 1 |
| Huntington, WV – Tristate | 34.2M | 0.30% | 199 miles | 171,859 | 2 |
* USACE 2018 ** Inland ports at least 25 miles in length